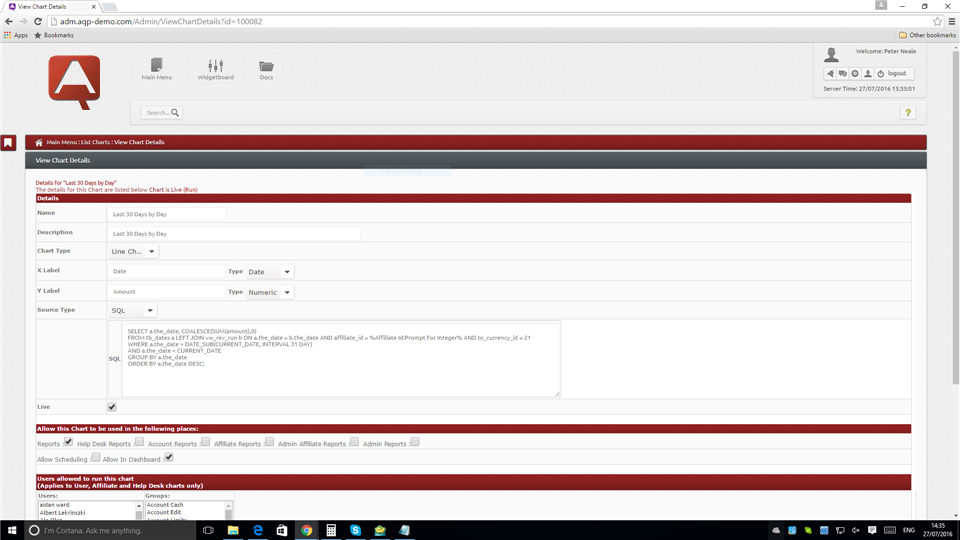
Use this screen to view or update the details of a chart, or run it. To access the screen, click an entry in the Name column of the List Charts screen.
The fields on this screen are grouped into a number of sections, and have the following properties:
| Field | Properties |
|---|---|
| Name | Meaningful name for the chart. |
| Description | Description of the chart. |
| Chart Type | Selected from: 'Bar Chart', 'Line Chart', 'Min Max Chart', 'Key Pair Chart', 'Pie Chart'. |
| X Label | Label name for the X axis, and type selected from: 'Date', 'Money', 'Numeric', 'Text'. |
| Y Label | Label name for the Y axis, and type selected from: 'Date', 'Money', 'Numeric', 'Text'. |
| Source Type | Source type selected from a list, and source details used to generate the chart content as follows: 'SQL', a SQL statement. 'Class', the chart class path and name. 'Query', query name, selected from those that are allowed to be used in charts. |
| Live | If ticked, indicates that the chart is live and available. |
| Field | Properties |
|---|---|
| Reports | If ticked, indicates that the chart appears in the Report Menu and the View GEP Reports screen. |
| Help Desk Reports | If ticked, indicates that the chart appears in the Help Desk Report Menu. |
| Account Reports | If ticked, indicates that the chart appears in the View Account Reports screen. |
| Affiliate Reports | If ticked, indicates that the chart appears in the Affiliate Report Menu and the View Affiliate Reports screen. |
| Admin Affiliate Reports | If ticked, indicates that the chart appears in the Admin Affiliate Report Menu. |
| Admin Reports | If ticked, indicates that the chart appears in the Admin Report Menu. |
| Allow Scheduling | If ticked, indicates that the chart can be scheduled by selecting it in the Schedule A Report pop-up screen. |
| Allow In Dashboard | If ticked, indicates that the chart can be specified as a Widget Report Item in the Widgetboard screen. |
| Field | Properties |
|---|---|
| Users/Groups | Users or groups allowed to run the chart. Select multiple users and/or groups by clicking with the Ctrl key pressed. Note that this applies to User, Affiliate and Help Desk Reports only. |
Change the details of the chart definition, then click the Update button to store them. Click the Run link at the top of the screen to display the Run Chart pop-up screen.
  www.aliquantum-gaming.com www.aliquantum-gaming.com [email protected]: [email protected]: |
2017 AliQuantum Gaming v3.0.201710130000 - 03/02/2017 - 16:28 v3.0.201710130000 - 03/02/2017 - 16:28 |